Static
Shipping Traffic Density
A visualization of maritime shipping traffic density around Europe using IMF's World Seaborne Trade monitoring data, revealing major shipping routes and trade patterns.
Sector: Trade & Transportation
Back to my maps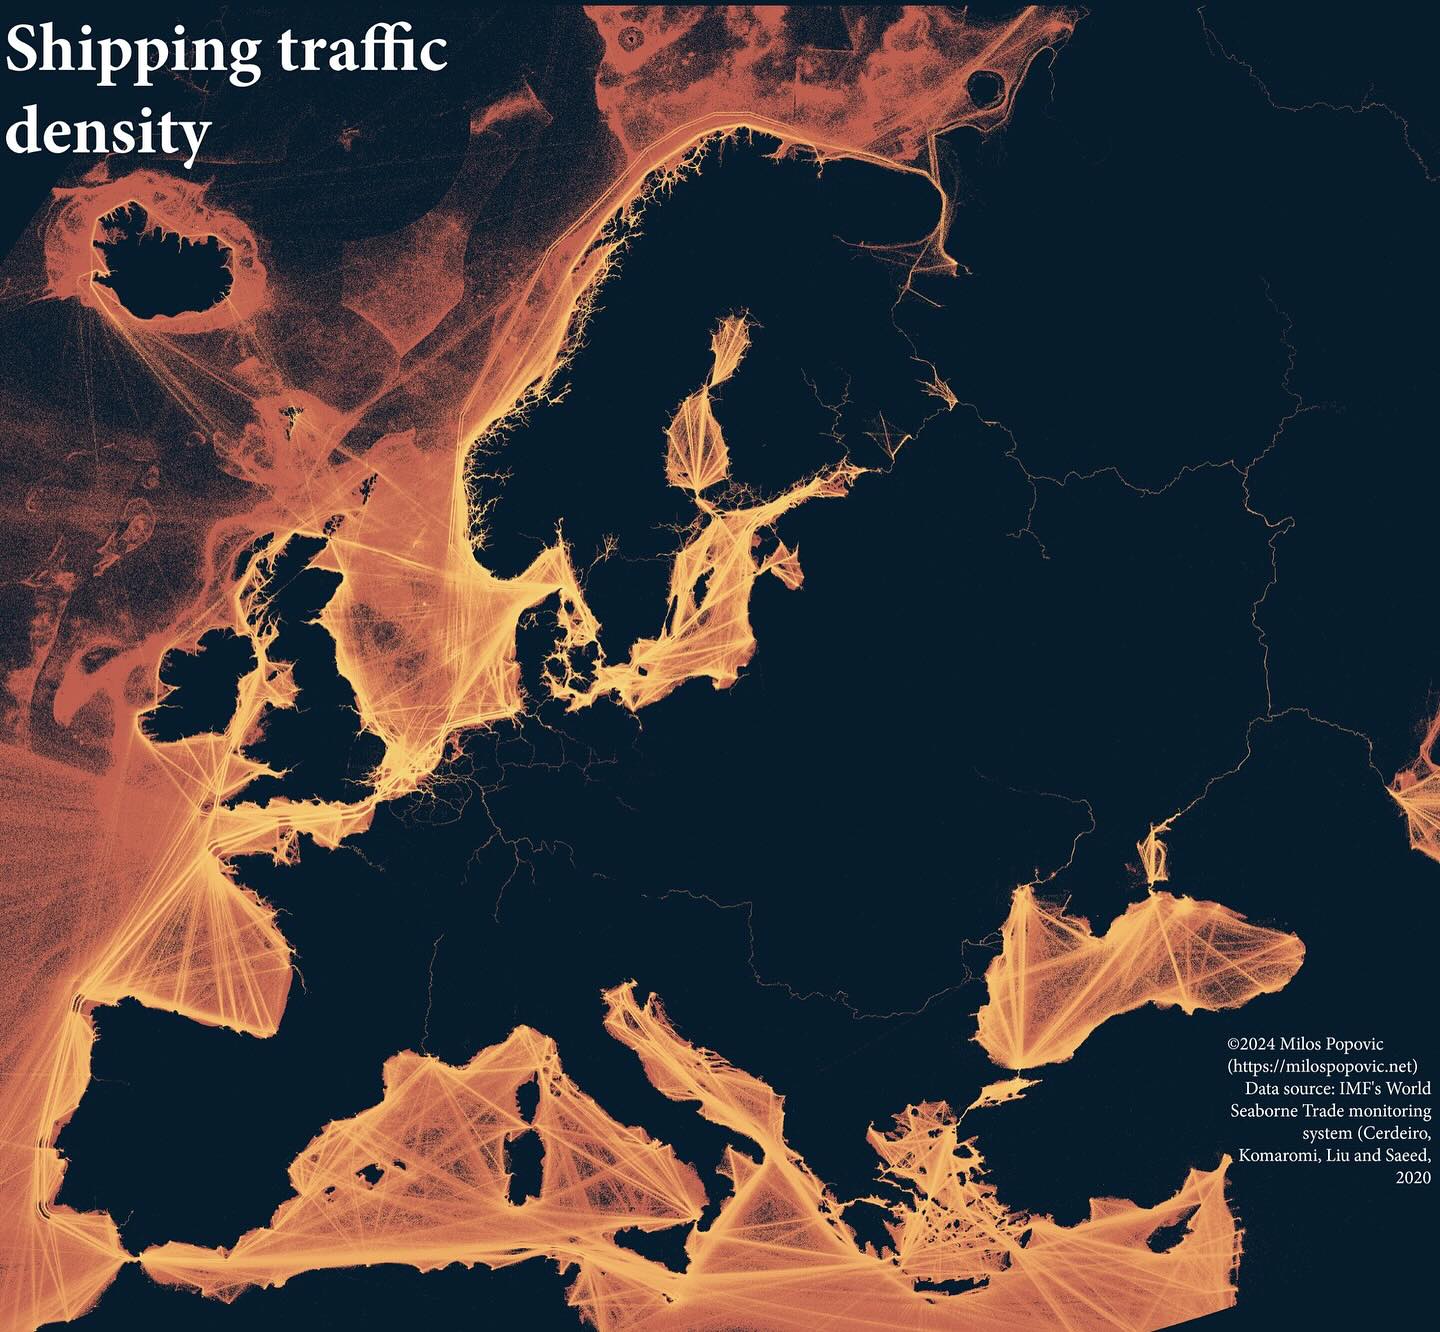
Shipping Traffic Density
Brief
Problem
Visualizing the intensity and patterns of global maritime trade requires processing complex vessel tracking data while creating an impactful visual that communicates the scale of seaborne commerce.
Result
Outcome
A striking visualization showing shipping lane density with glowing lines on a dark background, revealing the arteries of global trade around Europe.
Approach
Method
Processed IMF's World Seaborne Trade monitoring system data. Used R with sf and ggplot2 to create layered visualization with custom glow effects to emphasize traffic intensity.
Scope
Deliverables
- High-resolution map (print and web formats)
- Reproducible R script
- YouTube tutorial walkthrough
Reception
Results & Impact
Featured in discussions about global trade patterns and maritime infrastructure.
Source: Instagram Insights & YouTube Analytics (2024-12). Combined reach across social platforms
Stack
Tools & Data Sources
Tools
- R
- sf
- ggplot2
- dplyr
Data Sources
- IMF World Seaborne Trade monitoring system
Elsewhere
Links
Work together
Want a map like this?
Let’s scope your project and define the fastest path to impact.