Static
Europe: Temperature & Precipitation
A bivariate map showing mean annual temperature and precipitation across Europe (1970-2000), combining two climate variables in a single elegant visualization.
Sector: Climate & Environment
Back to my maps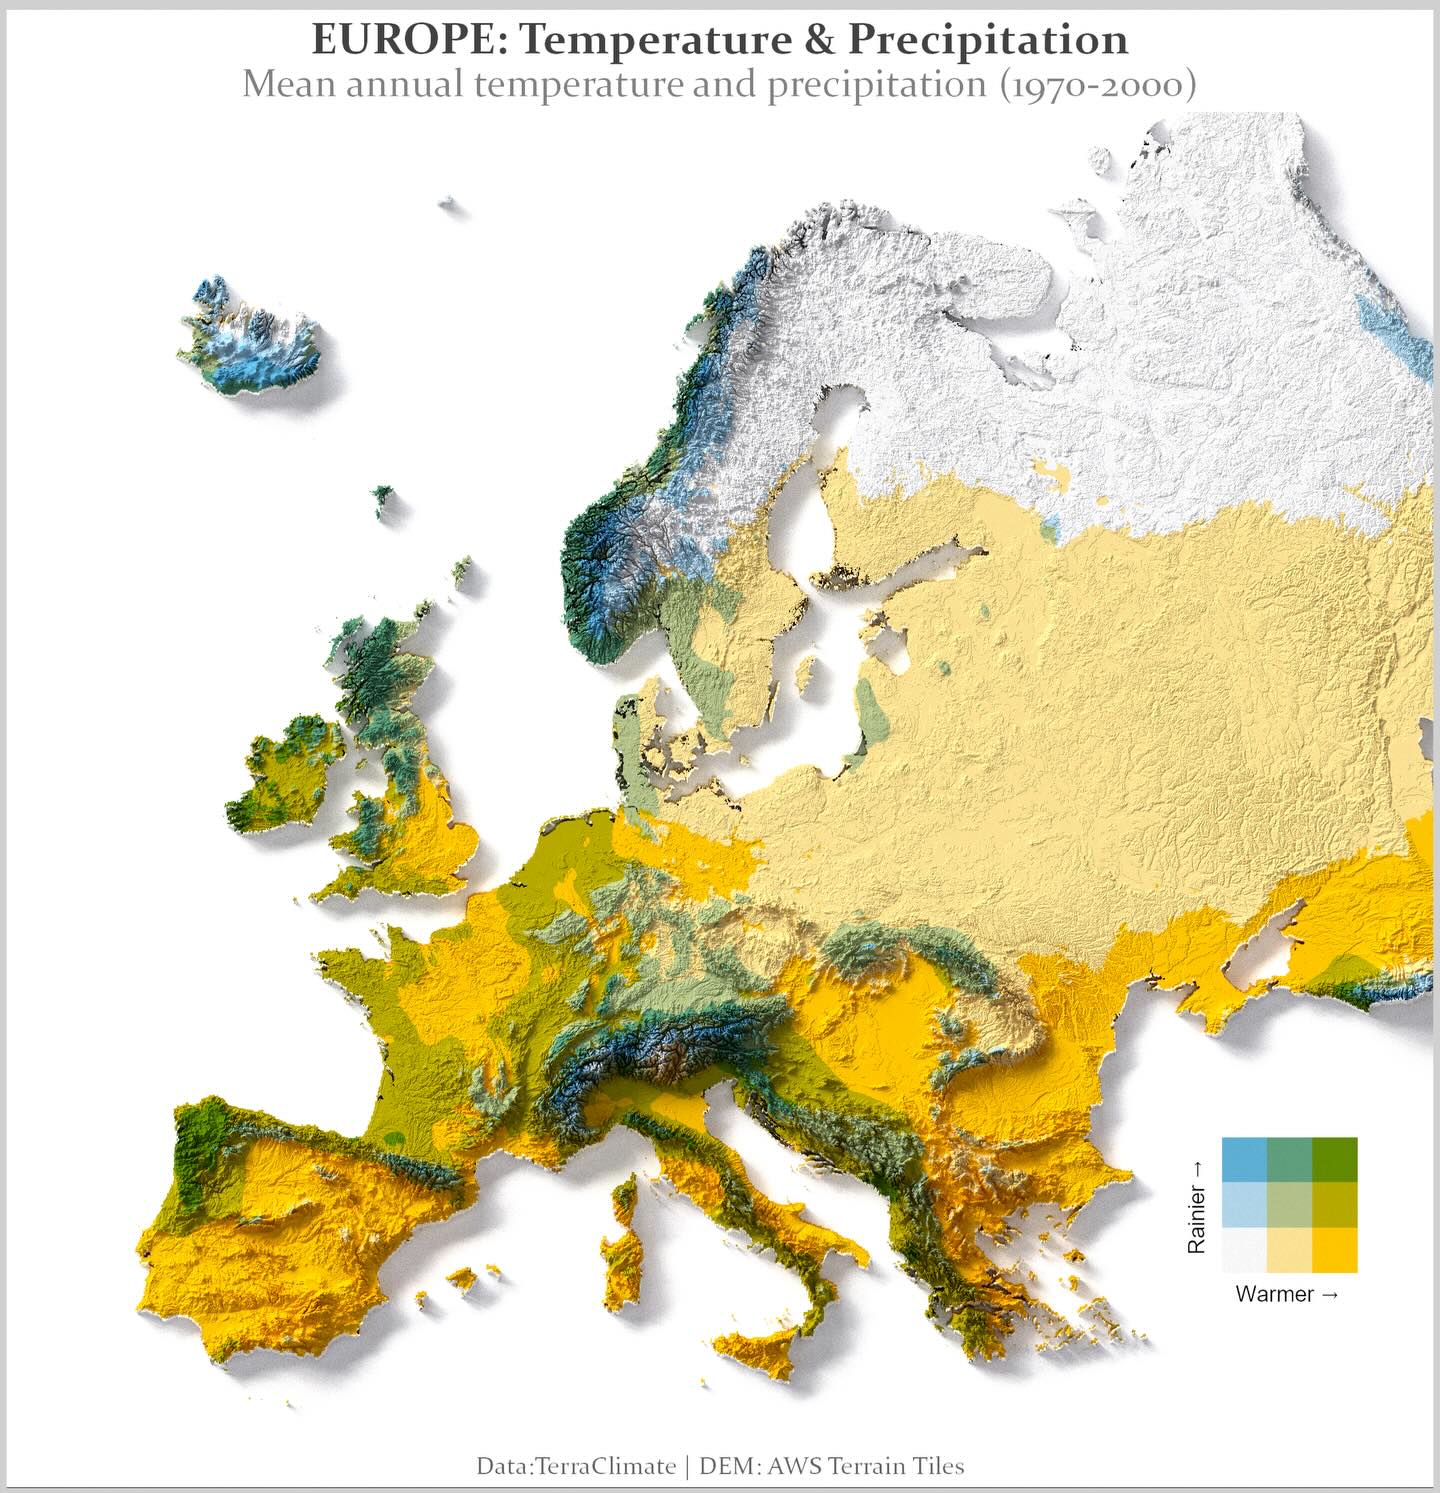
Europe: Temperature & Precipitation
Brief
Problem
Showing two continuous variables on a single map is challenging. Bivariate mapping techniques allow comparison of temperature and precipitation patterns simultaneously.
Result
Outcome
An elegant bivariate choropleth map that reveals climate patterns across Europe - from warm dry Mediterranean to cold wet Scandinavia - in a single view.
Approach
Method
Used TerraClimate data combined with AWS Terrain Tiles for the 3D effect. Created custom bivariate color scheme where color represents the intersection of temperature and precipitation values.
Scope
Deliverables
- High-resolution bivariate map
- Processing script
- YouTube tutorial
Reception
Results & Impact
Popular example of bivariate mapping technique, used as reference for climate data visualization.
Source: YouTube Analytics (2024-08). Tutorial views and community engagement
Stack
Tools & Data Sources
Tools
- R
- terra
- sf
- ggplot2
- rayshader
Data Sources
- TerraClimate
- AWS Terrain Tiles
Elsewhere
Links
Work together
Want a map like this?
Let’s scope your project and define the fastest path to impact.